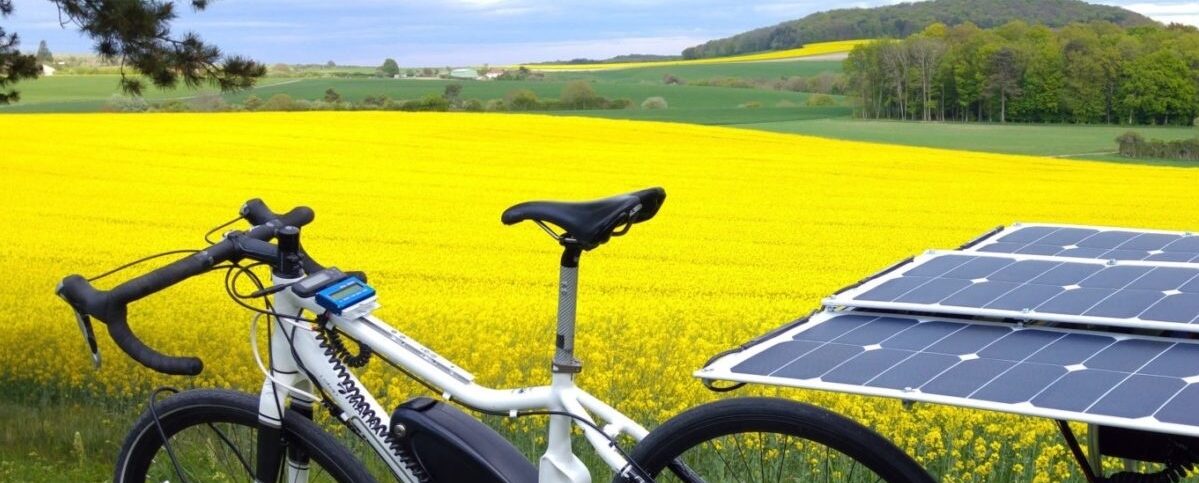
 After several days of rain, the Sun came back! It is slightly veed but no matter: I was too eager to test the solar panels received three days earlier! I compared them to the panels bought in 2017 and 2018. Although this test has no scientific value, the observations have seemed interesting enough to be published.
Test panels

|
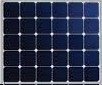
Panel A specified power: 50Wc nominal number of cells: 4 x 4 = 16 cell manufacturer: unspecified cell class: not specified provenance: purchase from a reputable reseller on internet price: 2 x €142 = €284 for 100Wc in 2017 |
 |
Panel B specified power: 100Wc nominal number of cells: 5 x 6 = 30 cell manufacturer: unspecified cell class: class C (visible defects) provenance: purchase on a famous auction website price: €135 in 2018 |
|
Panel C specified power: 110Wc nominal number of cells: 5 x 6 = 30 cells: SunPower™ Maxeon cell class: class A provenance: purchase from Linksolar manufacturer price: €350 (~ 395 USD) in 2019 |
Measuring the instantaneous power of the panels
Not having a solar energy measuring device, it was not possible for me to measure the actual performance of each Panel. So I chose to measure the instantaneous power of the panels with wattmeters, in the sunshine conditions of the moment. And I compared 2 to 2 the panels connected each to an identical charge regulator charging the same battery.
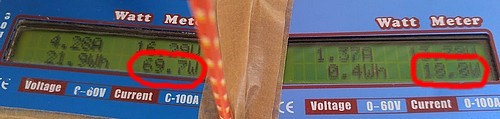
Measured power with panels B and C 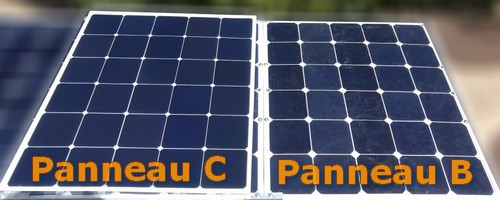
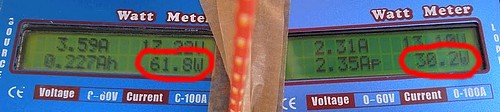
Measured power with panels A and C 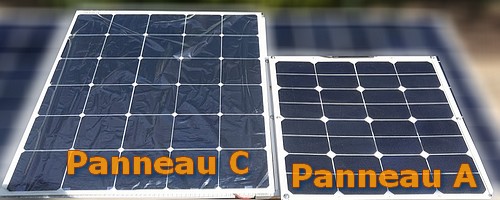
Reservations about the test protocol
Various elements could impact the outcome of the measures and their analysis:
-
- difference in the years of panel manufacturing, in a context of steady progression of cell performance;
- difference in State of obsolescence and use of panels: Panel C totally new, Panel B having travelled several thousand km (vibrations + shocks), Panel A of 2017 never used and stored;
- calibration difference of non-certified wattmeters;
- measurements made by veted Sun (repeat the test in other conditions of sunshine).
However, these elements can not fundamentally call into question the results obtained.
Calculations and results
The C Panel being the most powerful, I took it as a reference. I calculated the ratio of the power produced by Panel A or B to the power produced by Panel C. The table above shows the relative efficiency of panels A and B in reference to Panel C, which therefore has an efficiency of 100%. Pushing the reflection further, I imagined an increase in the surface of panels A or B to get the same power as the C Panel. I then calculated the cost in corresponding A or B panels, and the corresponding panel surface.
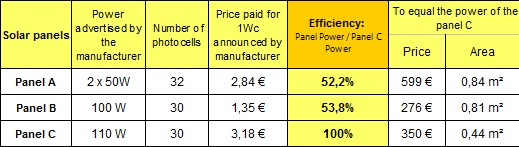
NB: I took into account the difference in the number of cells (Panel A: 16 cells, panels B and C: 30 cells).
When observing this table, the following remarks can be issued:
Real power:
- panels A and B have almost identical power while panel A is 2 times more expensive than panel B;
- the power of panel C is almost double that of panels A and B.
Price to get the same real power:
- at equal power, panel A is 71% more expensive than panel C;
- at equal power, panel B is 21% cheaper than panel C.
Surface to achieve the same real power:
- at equal power, panels A and B occupy 90% more surface area than panel C.
Personal notes
Objective and subjective criteria had guided my purchases:
- in 2017, I totally discovered the universe of the solar panel, it had reassured me to buy at a large recognized website, the many exchanges by phone and email had given me confidence.
- in 2018, I wanted to experiment with a low-spread panel format (6×5 = 30 cells) and I had found on the market only these panels at low prices.
- in 2019, I had the urge and the opportunity to invest in quality equipment, to increase the performance of my bike.
Conclusions
- A high price is not always a guarantee of the performance of the equipment.
- Lower yield panels (50%) have a strong impact on the solar bike: less autonomy or increased dimensions. In both cases, this will degrade the rider’s comfort and safety.
- A higher expense for quality equipment ultimately represents an economy: the value for money is much better.
Not to mention the other benefits: autonomy, maneuverability, performance…
Views: 272